# Analytics & Distribution
The **Analytics & Distribution** section in LogYourTrades provides a comprehensive overview of your trading performance, activity, and portfolio behavior through a set of interactive metrics, charts, and distribution breakdowns.
***
### Key Metrics & Performance Overview
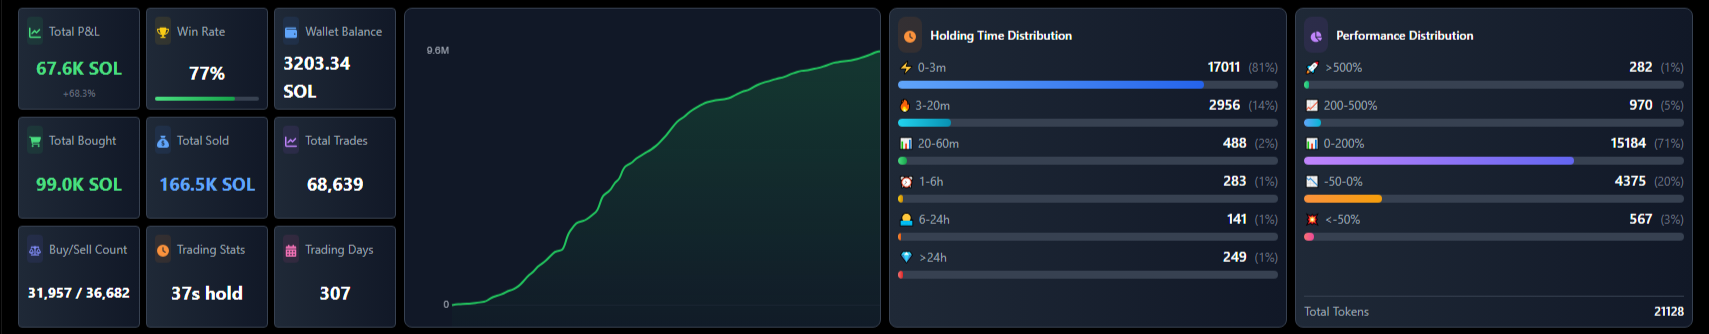
At the top, you’ll find a series of **metric cards** summarizing your trading results for the selected period:
* **Total P\&L:** Shows your cumulative profit and loss (in SOL), with a percentage change indicator.
* **Win Rate:** Displays the percentage of your trades that were profitable.
* **Wallet Balance:** Your current total balance in SOL.
* **Total Bought/Sold:** The total amount of SOL you’ve bought and sold.
* **Total Trades:** The number of trades executed.
* **Buy/Sell Count:** The number of buy and sell transactions.
* **Trading Stats:** The average holding time for your trades.
* **Trading Days:** The total number of days you’ve been actively trading.
These metrics give you a snapshot of your trading activity and results at a glance.
***
### Cumulative P\&L Chart
The central chart visualizes your **cumulative profit and loss** over time. This interactive graph lets you track your trading journey, showing how your P\&L has evolved and highlighting periods of significant gains or drawdowns. It’s designed to help you quickly spot trends, growth phases, or challenging stretches in your trading history.
***
### Distribution Insights
On the right, two advanced distribution panels provide deeper analysis of your trading behavior:
### Holding Time Distribution
This breakdown shows how long you typically hold your tokens before selling. The categories include:
* **0–3 minutes**
* **3–20 minutes**
* **20–60 minutes**
* **1–6 hours**
* **6–24 hours**
* **Over 24 hours**
You’ll see both the count and percentage of trades in each holding period, revealing whether you tend to scalp, swing, or hold positions longer term.
### Performance Distribution
This panel categorizes your trades by their outcome:
* **>500% gain**
* **200–500% gain**
* **0–200% gain**
* **-50–0% (loss)**
* **<-50% (large loss)**
Each category displays the number and percentage of trades that fall into that performance bracket, helping you understand your risk and reward profile across all trades.
***
### Why It Matters
The **Analytics & Distribution** section transforms your raw trading data into actionable insights. By combining high-level metrics, a dynamic P\&L chart, and detailed distribution breakdowns, you gain a clear understanding of both your results and your trading style. This empowers you to refine your strategies, manage risk, and build on your strengths as a Solana trader.